1. First Steps
Before starting, you must create an account by clicking here or log in by clicking here to access your personal dashboard.
Once logged in, the first thing we must do is go to the Settings section and configure each of the aspects. After that, we can head to the Manage Portfolio Section and start creating our data entries.
Once we log the minimum required months, we will be able to access the Metrics and the Main view (where the Q-Core 21 are located). This number varies depending on the required function.
2. Home
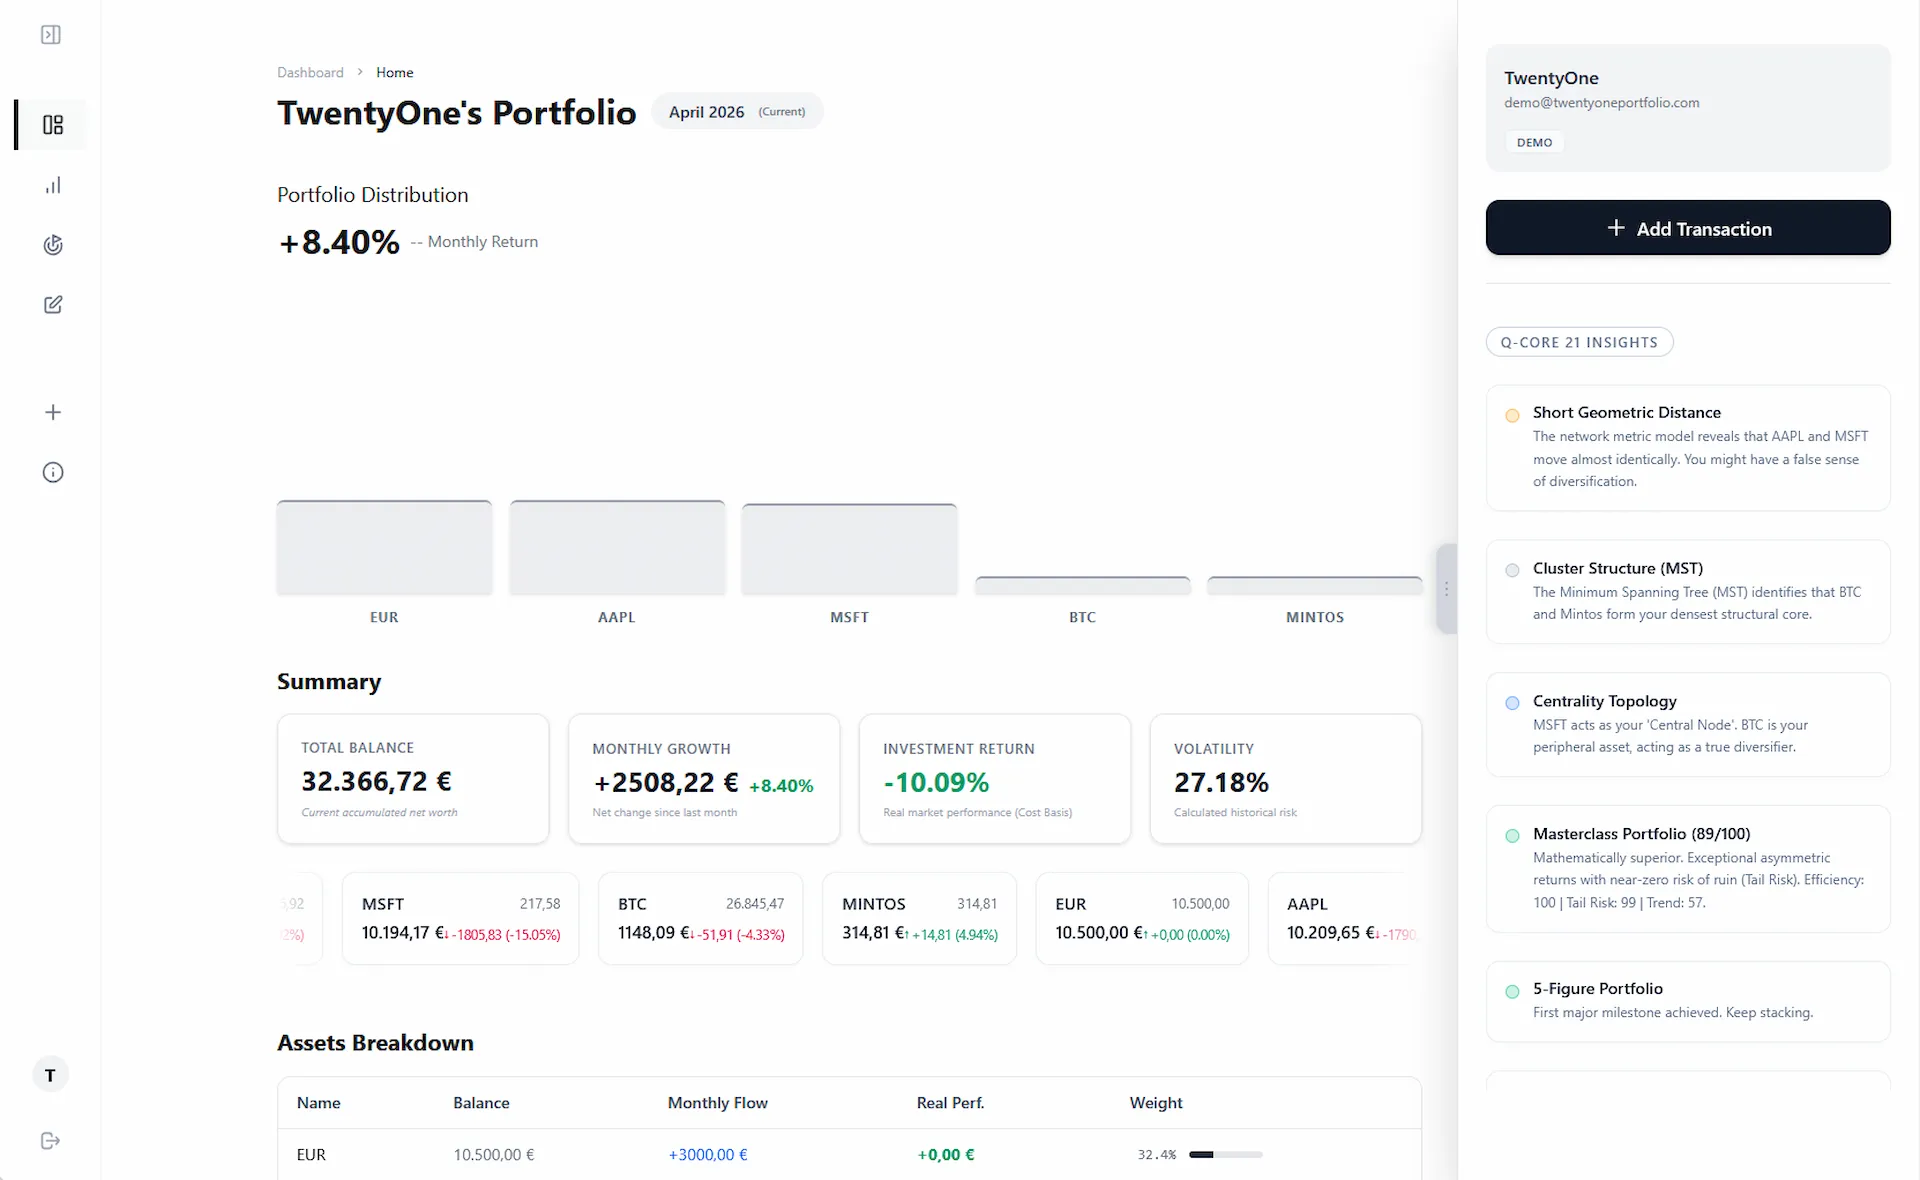
This is where you will access a comprehensive summary of your portfolio. Note that some features vary depending on your device: (D) for Desktop and (M) for Mobile.
-
(D)
Month Navigation: You can view your portfolio's historical summary by switching months using ctrl + ← or →, or simply by clicking on the month's name.
-
(M)
"Others" Category: On smaller screens, secondary assets may be grouped under "Others". Click on Scroll to expand and see the full list of assets..
-
(D/M)
Summary: Includes your Total Balance, Monthly Change, and Monthly Volatility.
Asset Cards
Each card displays the asset name and its current market price on the right. At the bottom, you will find its total value in your portfolio and its overall profit or loss.
Q-Core 21
Q-Core 21 is an advanced diagnostic engine that evaluates the overall health of your portfolio. Its exceptional reliability comes from the fact that it does not try to predict the market; instead, it audits your actual risk exposure based strictly on empirical mathematics. It is built on four core pillars: Quantitative Analysis (measuring efficiency, volatility, and fat-tail risk), Structural Health (evaluating the true correlation and diversification of your assets), Behavioral Analysis (detecting psychological biases such as FOMO or panic), and Gamification (tracking your wealth accumulation journey, rewarding milestones, and helping you stay focused on your long-term goals). By intersecting these four dimensions, the system acts as a relentless auditor capable of detecting systemic vulnerabilities before they impact your capital, all while keeping you motivated on your financial journey.
-
(M)
To view insights, tap or slide the cards. If you tap a button or slide the cards, a bottom sheet interface will appear displaying all your insights.
-
(D)
To access these, you must slide out the right sidebar tab on your screen.
Asset Breakdown Table
A detailed table showing key data for each asset, including: Name, Balance, Monthly Flow (Buy/Sell orders), and Weight.
Note: Real Performance (Total Profit/Loss) is only calculated for assets marked as "Investment". If you are unsure about this tag, please refer to the Manage Portfolio section.
3. Metrics
In this section of the platform is where all our charts and alerts appear. It is necessary to know the difference between alerts and Q-Core 21 Insights.
The former are user-configurable and are not interpreted by the software. Q-Core 21 Insights adapt to the portfolio's investment profile; however, they are not as configurable as the alerts.
Chart Controls
You can manage each chart individually using the context badge:
- Desktop: Hover your mouse over any chart area to reveal the top grip-bar. Click on it to display the badge with Expand or Hide options.
- Mobile: Simply tap on the top area of the chart box to toggle the badge visibility and access the expansion/hiding controls.

Data Availability
If you notice that a specific chart cannot be enabled in the dashboard settings, it is because the system has detected insufficient data to perform the required calculations. We prevent visible charts from being empty to ensure a clean and functional interface.
If a chart currently on your dashboard displays an "Insufficient Data" error message, please follow the instructions provided within that specific box. If you believe this is a technical error, feel free to contact our support team at info@twentyoneportfolio.com and we will gladly assist you.
3.1. Alerts Configuration
-
•
Missing Monthly Log: Indicates that data from the previous month is missing. Without continuity, profitability and risk calculations lose precision.
-
•
Overweight Asset: The asset has risen significantly or you have bought too much, exceeding the limit allowed by your target and margin.
-
•
Underweight Asset: The asset is below your minimum target.
-
•
Poorly Diversified Portfolio (High HHI): The Herfindahl-Hirschman Index is high. A few assets dominate almost the entire value of your portfolio. If one falls, you suffer greatly.
-
•
Concentration by Working Capital: The HHI is high, but it is due to cash (liquidity).
-
•
High Average Correlation: Assets move in the same way. If the market falls, all your assets will fall at once. You are not effectively diversifying risk.
-
•
Negative Annualized Return: You are losing money on an annualized basis.
-
•
Growth Diluted by Liquidity: Your total return is low, but your investments are doing well. You have too much uninvested cash that is "slowing down" the growth of your total wealth.
-
•
High/Low Growth: Comparison against your personal goals (cagr_low and cagr_high constants).
-
•
High Maximum Drawdown: You have suffered a drop from the highest point exceeding your tolerance limit.
-
•
Effective Use of Working Capital: The total Drawdown was high but the drawdown of the investments was not.
-
•
Excessive Drawdown Duration: You have been without recovering your previous maximum for too long.
-
•
Low Sharpe Ratio (< 0.5): The return you get does not compensate for the volatility you suffer.
-
•
Sharpe Diluted by Liquidity: The ratio is low in total, but high in investments.
-
•
Low Sortino Ratio: Bad relationship between profitability and "bad volatility" (drops).
-
•
Excellent Calmar Ratio (> 1): Your annual return is greater than your maximum drop.
-
•
Low Stability (< 50% positive months): You lose money more months than you gain.
-
•
Negative Skewness (Bias): Tendency to have large sudden losses.
-
•
Positive Skewness (Bias): Tendency to have occasional explosive gains.
-
•
High Kurtosis: High frequency of extreme movements (positive or negative). "Scary" portfolio. Normal movements are rare; almost everything is sudden jumps.
3.2. Charts
(Note: Some of these charts may not be visible even if selectable due to insufficient registered months).
-
01
Linear Regression: Plots a trend line over your portfolio growth to see the general direction.
-
02
Monte Carlo Simulation: Projects thousands of possible future scenarios based on your past volatility. Check the "worst-case scenario" (low percentile); if that result concerns you, you may need to lower your risk.
-
03
Asset Evolution: Shows how the value of each individual asset has grown over time.
-
04
Asset Increment: Displays the monthly increase or decrease for each asset.
-
05
Portfolio Quality Radar: A spider chart that scores metrics such as Profitability, Risk, Diversification, and Consistency.
-
06
Volatility and Return: Compares how much your portfolio moves (risk) against how much you earn.
-
07
Asset Correlation: A matrix measuring if assets move together. Positive (near 1) means they move together; negative (near -1) means they move in opposite directions; near 0 means they are independent.
-
08
Risk-Return: Maps assets on an XY axis to quickly identify the relationship between risk and reward.
-
09
Annual Distribution Boxplot: Shows the dispersion of your annual returns, identifying exceptional years (outliers).
-
10
Yield Distribution (Log): Analyzes the frequency of gains and losses on a logarithmic scale to see the "normality" of your returns.
-
11
Modigliani M2: Translates the Sharpe Ratio into a percentage return, showing what return you would have if your portfolio had the same risk as the market.
-
12
Ulcer Index / UPI: Measures financial stress based on the depth and duration of drawdowns.
-
13
Smart Target Control: Automatically monitors if you are deviating from your target investment weights.
-
14
Net Profit History: The curve of your actual realized earnings.
-
15
Break-even Analysis: Calculates the market price vs. the average price paid. If the average is lower, you are in profit.
-
16
Annual Returns: Bar chart showing the performance of each calendar year (configurable for specific assets or the whole portfolio).
-
17
Seasonal Liquidity: Analyzes the fluctuations across different months to identify recurring seasonal trends.
4. Board
The Q-Core 21 Board is an advanced visual interface that translates complex math into interactive charts. Basically, it acts as a visual auditor that analyzes your portfolio's structure.

Why are some of my assets missing from the board?
If you notice some of your assets are missing, don't worry. To ensure accuracy and eliminate misleading market movements, the system applies strict filters:
- Minimum history: For two assets to connect on the chart, they need at least 12 months of shared price history.
- Statistical certainty: The relationship between assets must be proven with a 5% margin of error or less. If a market movement could simply be due to random chance, the system will hide that connection.
- Fixed-income assets: Assets with fixed, unchanging returns (like certain P2P loans) have no variability. Mathematically, this means they cannot be compared to changing market risk, so they are excluded on purpose.
- Pattern detection: Even with 2+ assets and 12+ months of data, the board may appear empty if our algorithm fails to detect a statistically significant patternbetween them. If the data lacks sufficient "weight" or coherent directionality, the system will not force a correlation that isn't mathematically real.
Correlation Network (Interactive Graph)
Looking at the Correlation Network, you'll see a simulation where the visual distance between elements represents the risk level. You can interact by hovering your cursor or tapping on mobile over any node (the circles) to see specific data like its Role, Centrality Level, and Average Return. If you hover over the lines connecting them, you will see their exact correlation level. Feel free to click and drag the circles to explore the graph!
- Thick lines and close nodes: Indicate high correlation. They share the same risk and will likely drop together if the market goes down.
- Dashed lines and distant nodes: Act as a true shield or hedge, moving in the opposite direction of the rest.
- Circle size: The larger the circle, the higher its risk of dragging down the rest of your portfolio.
Risk Centrality (Radar)
This tool works like a circular map, designed like a dartboard, to help you locate threats in your portfolio. Assets sitting right in the center of the radar ("Core Risk") are the ones that could drag down your entire portfolio if something goes wrong. Conversely, the further an asset is pushed to the outer edges, the better it works as a "true diversifier" or safe haven.
Capital Flow (Sankey Diagram)
Finally, this diagram offers a deep analysis of how your money is distributed and flows. By hovering over the paths you can see exactly how much weight the money flowing from your main portfolio into specific risk groups has.
- Core Nodes (dark): Represent a high risk to the system.
- Refuge Nodes (light): Represent safety.
The thickness of these paths shows you the amount of money at stake, giving you a quick way to check, at a glance, if you are investing too much in the riskiest assets instead of properly funding your safety nets.
5. Debts
The Debts section is a professional ledger to manage complex credits, mortgages, and lent money. It separates your records into two distinct categories: Assets (Owed to me) and Liabilities (I owe).

5.1. Register Operation
To create a new record, click on + New Record and fill in the financial details:
- Counterparty & Concept: Identify the person or entity, and the reason for the debt.
- Principal Amount: The initial capital lent or borrowed.
- Interest Settings: You can apply No Interest, Simple/Fixed Interest, or Compound Interest. If you select Compound, you must specify the compounding frequency (Daily, Monthly, or Yearly). Note: The rate entered must always be the Annual Percentage Rate.
- Internal Notes: Add private annotations for your own context.
5.2. Amortization & Real-Time Balance
The platform features a dynamic interest calculation engine. Your active balances will automatically grow over time based on the interest type and frequency you configured.
When recording a payment (clicking on Amortize), the system will calculate the exact accrued interest up to that very second before applying your deduction. If the interest generated exceeds the original principal, the progress bar will highlight this exposure in red or orange.
6. Manage Portfolio
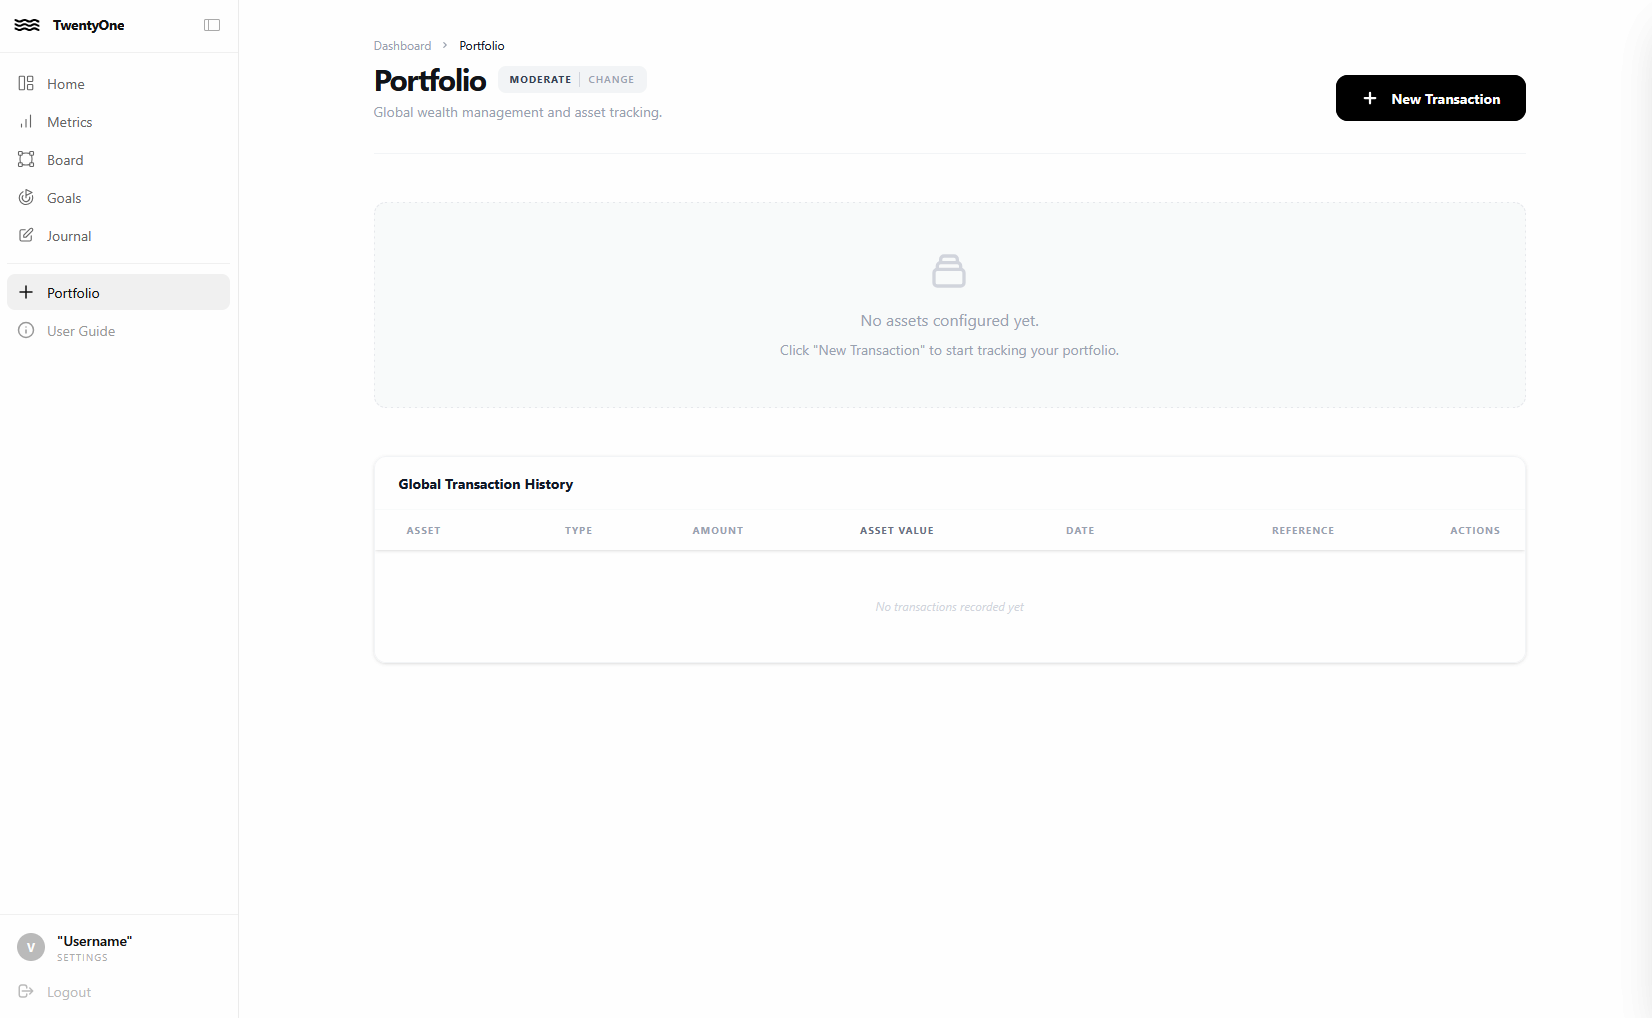
This section allows you to perform two primary actions: log new transactions or update asset valuations. Both actions follow a standardized workflow:
Quick Access (Right-Click)
For a faster workflow, you can right-click anywhere on the main Portfolio screen to open a custom context menu. From there, you can instantly launch the wizards to Create Asset or Create Folder without needing to navigate through the interface buttons.
6.1. Create Asset
- Begin by clicking on the NEW TRANSACTION button, or simply right-click anywhere and select Create Asset.
- Enter the name of the asset you wish to add and click Add "[Asset Name]".
- The system will automatically detect the asset (see our pre-configured assets directory) or prompt you to configure it manually.
- For manual configuration, you must define the asset's classification type and its designated usage strategy.
Important
Accurate data interpretation by TwentyOne relies heavily on selecting the correct Usage Strategy for each asset.
- Investment: Assets held with the expectation of generating future returns over a specific timeframe (e.g., S&P 500 index funds, stocks).
- Working Capital: Highly liquid assets utilized for operational or day-to-day expenses (e.g., cash, bank accounts, or liquid funds).
Once configured, click Create Asset to finalize the setup.
6.2. Add Transactions
To record a new transaction, navigate to New Transaction and select the relevant asset from your portfolio.
Typically, you will only need to update the total portfolio valuation at the end of each month (accounting for monthly expenses). However, if you need to explicitly log specific cash inflows or outflows, you can enable the "Record Transaction History?" toggle.
Record specific trades by defining the transaction type (Buy/Sell), the exact quantity transacted, and the newly updated total portfolio value.
If your goal is solely to update the asset's current market valuation without recording a new trade, simply leave the Quantity and Amount fields blank.
Quick Edit Alternative: You can also hover over any asset's value in the Total Net Worth panel and click the pencil icon to instantly update its valuation for the selected month.
Important
Ensure transaction types are recorded accurately. The system automatically calculates your total asset holdings by aggregating 'Buy' orders and deducting 'Sell' orders.
6.3. Asset Configuration
Hide Assets
You can hide specific assets from the Metrics view to maintain a clean and focused interface. Hidden assets remain active in background calculations (such as diversification and risk metrics) and will continue to be visible on your main HOME dashboard.
Configure Assets: Allocation Margins
Establish target allocation weights for your assets and define acceptable variance margins to trigger automated alerts when rebalancing is needed.
- Lower Bound: Triggers an alert if the asset's weight drops below the specified threshold.
- Upper Bound: Triggers an alert if the asset's weight exceeds the specified threshold.
- Bidirectional (Both): Triggers an alert if the weight deviates in either direction from the defined margins.
Edit Asset Settings
Click the gear icon next to an asset to modify its core settings or to permanently delete it from your portfolio. To rename an asset, simply double-click its current name.
6.4 Folders & Grouping
Folders are designed to help you structure your portfolio without altering your financial data. Think of folders as labels that allow you to organize assets by type, strategy, or liquidity.
By default, folders are purely organizational. Adding an asset to a folder does not change its individual performance, alerts, or Q-core 21 calculations.
How to group your assets
- The Fast Way (Wizard): Right-click anywhere on the Portfolio page and select Create Folder. A setup wizard will appear allowing you to name the folder, select all the assets you want to include via checkboxes, and configure its targets and chart grouping behavior in one single step.
- The Manual Way: Click Configure on any asset and enter a folder name in the Folder / Group field. To add more assets to the same group, enter the exact same folder name in their respective configuration fields.
Visual Grouping (Metrics)
You decide how these folders appear in your analytics. Within each asset's configuration, you will find a Folder Grouping toggle:
Beyond organization, you can now manage your folders as powerful analytical entities. Clicking the Configure button directly on a folder row in your portfolio allows you to tailor how these groups behave in your metrics.
Folder Settings
- Rename Folder: Update the folder name to automatically update all associated assets.
- Group in Charts: Toggle the Group Folder in Charts option to decide whether to view the folder as an aggregated entity or keep individual assets visible in your analytics.
- Folder-Level Targets: You can define Target Allocations specifically for a folder. This allows you to set strategic weights for entire categories (e.g., "Liquid Fund" or "Long-term Crypto") rather than just individual assets.
Removing Assets from Folders
If you wish to remove an asset from a specific folder, you do not need to modify the folder itself. Simply click the Configure button on the individual asset, navigate to the Folder / Group field, and leave it empty. Once you save your changes, the asset will be dissociated from that folder and will appear as an independent entry in your portfolio.
Deleting an Entire Folder
You can permanently delete a folder directly from its configuration panel using the Delete Folder button. This action is completely safe for your financial data: it will not delete the underlying assets. It simply un-groups them, removing the folder label from your portfolio and returning the assets to an independent status.
Smart Target Control Integration
Any folder or asset with a target greater than 0% will automatically appear in the Smart Target Control graph.
Note that folders and assets are treated as independent entities in this selection menu. This means you can monitor a specific Folder Target alongside an individual Asset Target simultaneously, regardless of whether your folder is currently set to "Grouped" mode in your charts.
6.5. Dividend Tracking
TwentyOne Portfolio allows you to seamlessly track income generated from dividend-paying assets. By configuring an asset's dividend profile, the system will automatically calculate and project your expected payouts when logging monthly balances.
How to Set Up Dividends
To enable dividend tracking for a specific asset, follow these steps:
- Click the Configure button on any investment asset in the Asset Configuration table.
- Scroll down to the Dividend Tracking section and toggle it ON.
- Annual Yield (%): Enter the expected annual dividend yield (e.g., 4.5). This percentage is used to estimate your payouts based on your total invested capital.
- Payout Frequency: Select how often the dividend is distributed (Monthly, Quarterly, Semi-Annually, or Annually). The system uses this to divide the annual yield into the correct payout increments.
Automated Payout Logging & Profitability
Once configured, whenever you log a new transaction or update your monthly balance for that asset, the Wizard will dynamically auto-calculate your Dividend Earned for that period. If the actual payout differs slightly due to market fluctuations or broker fees, you can manually adjust the auto-calculated amount before saving.
Why is this important? It is crucial to accurately record the exact dividend amounts you receive each month. TwentyOne Portfolio factors these cash payouts into your overall analytics. Accurate monthly logging ensures that your Total Return and profitability calculations correctly reflect both your asset's capital appreciation and the passive income it has generated.
Important Note on Balances: Logging the dividends earned in the Wizard is strictly for tracking your asset's real profitability. This action does not automatically add that cash to your portfolio's total value. If you keep this cash in a Working Capital wallet (such as a "Liquid Fund" or "Bank Account"), you must manually register the deposit of those dividends into that specific wallet.
Viewing Dividend History
To review all past dividend payouts, click the History button next to the asset. A modal will appear where you can toggle between the Transactions tab (buys/sells) and the newly enabled Dividends tab. This provides a clean, isolated ledger of your passive income stream over time.
7. Settings
This section provides comprehensive controls for your account configuration, platform preferences, and personal information management.

7.1. Edit Profile
- Full Name
- Username
- Email Address
- Base Currency (EUR, USD, GBP, JPY, MXN, ARS, CLP, COP) (Support for additional fiat currencies coming soon)
- Password Management
To apply any modifications, you must authenticate by entering your current password. Note for Google SSO users: If you registered via Google, you are required to establish a master password here. This step is critical; without a master password, you will be unable to access the Journal, as it relies on this credential for its end-to-end encryption protocols.
7.2. Subscription
This section provides a comprehensive overview of your subscription details, including billing information, payment history, and account limitations.
- Active Subscriptions and Invoice Generation
- Account Limits & Resource Capacity (e.g., historical data storage quotas)
- Payment History (Displays your 20 most recent billing cycles)
7.3. Home View
Coming soon: Advanced layout and widget customization options for your main dashboard.
7.4. Config Portfolio
This section is fundamental to the accuracy of your Q-Core 21. By defining your portfolio's risk tolerances and baseline thresholds here, our algorithms can calibrate their analytical parameters to perfectly align with your specific investment strategy.
7.5. Metrics & Graphs
Customize your analytical environment by establishing default chart visualizations and defining the core computational parameters for your Monte Carlo simulations.
Performance Warning
Exercise caution when escalating simulation parameters. Excessively high values require significant computational load and may cause temporary browser unresponsiveness on devices with limited processing capabilities.
7.6. Config Alerts
Notification Behavior
- 01Always Open: Alerts automatically display upon every visit to the metrics dashboard.
- 02Intelligent Open: Alerts trigger only during your initial session of the day.
- 03Manual Open:: Automatic pop-ups are disabled; alerts must be accessed manually.
System Parameters
We strongly advise maintaining the default settings unless you are familiar with these algorithmic variables.
If you experience unexpected behavior after adjustments, utilize the Reset to defaults button to restore the original baseline configuration.
7.7. Other & System
Review technical system details (such as current software version and framework base) and access critical data privacy controls, including the option to PERMANENTLY delete your account and all associated records.