Stop Tracking Net Worth in Excel: Why Spreadsheets Fail
Rubén Pérez Aledo
Founder, TwentyOne
Most investment journeys commence with a familiar tool: the blank spreadsheet. Initially, it provides a profound sense of financial sovereignty. You meticulously log your deposits, construct foundational =SUM() formulas, and watch your net worth incrementally update. It grants an immediate feeling of absolute control.
However, as your capital scales, your portfolio inevitably diversifies. You incorporate international equities, broad-market ETFs, allocate working capital across various institutions, and perhaps introduce alternative assets. Gradually, the simple spreadsheet devolves into a fragile labyrinth of interconnected cells, static data, and structural limitations.
The reality is this: managing complex wealth in a spreadsheet is not merely an inefficient use of time; it actively obscures your true financial risk.
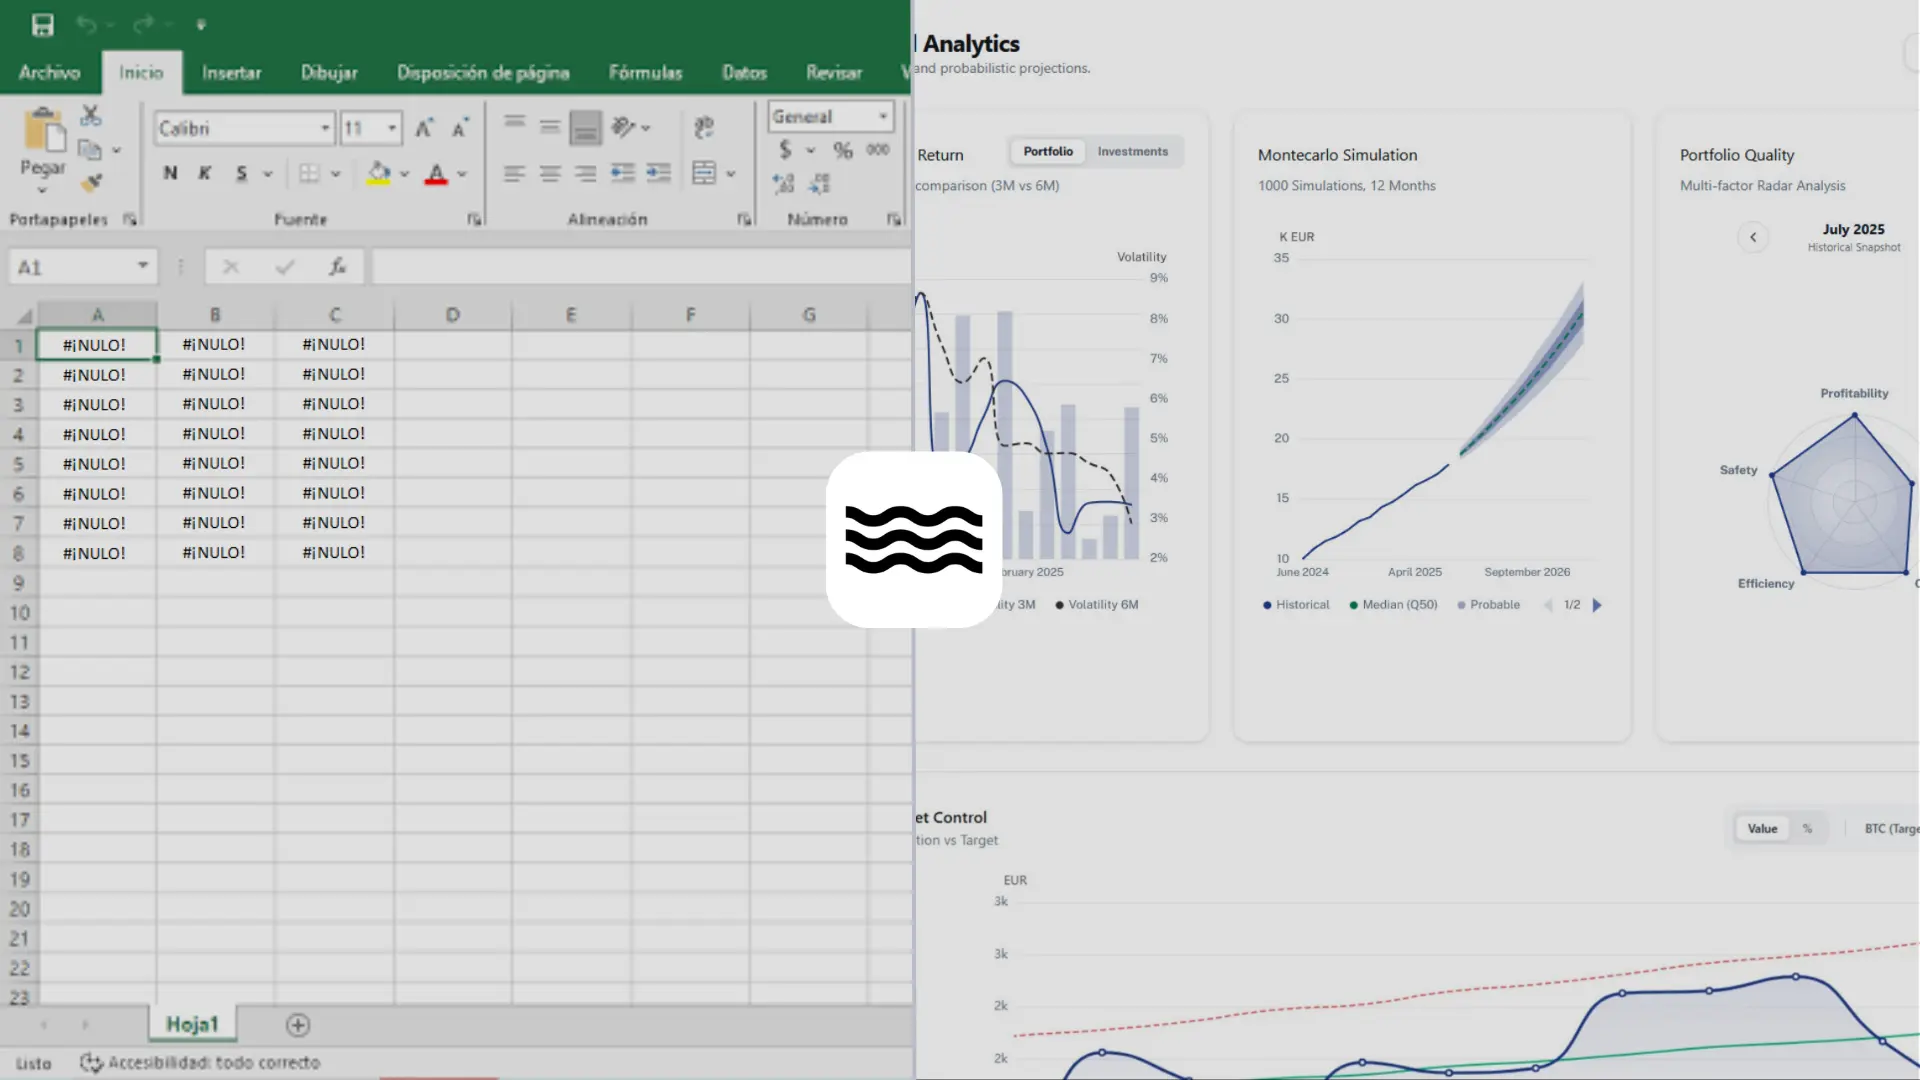
1. The Architectural Fragility of Spreadsheets
While spreadsheets are unparalleled instruments for basic accounting, they are fundamentally inadequate for dynamic wealth management. The core deficiency lies in the vast disparity between static ledger tracking and institutional-grade risk analysis.
- The Calculation Trap: In a spreadsheet, every new asset requires new formulas. The manual data entry of your trades is not the issue; the vulnerability lies in manually constructing the mathematical architecture to analyze those trades. A single misplaced cell reference or formula error can invisibly corrupt your entire historical performance curve.
- The Maintenance Burden: As your portfolio evolves, your spreadsheet requires constant structural redesigns. Adding a new asset class often means rebuilding charts, adjusting weight formulas, and modifying summary tables to accommodate the new variables.
- The "Snapshot" Limitation: An Excel file is ultimately a static snapshot. It dictates what your portfolio was worth at the exact moment you recorded the data, but it lacks the algorithmic capacity to dynamically cross-reference those figures against advanced volatility or correlation models.
2. Tracking Balance vs. Measuring Risk
This is the most critical failure of traditional spreadsheet management. When you open a manual ledger, the primary outputs are typically an asset allocation pie chart and a total balance figure. This fosters a dangerous illusion of security.
Knowing that 40% of your net worth resides in equities and 60% in real estate reveals absolutely nothing about your structural health. A standard spreadsheet cannot readily calculate your annualized volatility, process your maximum drawdown limits, or generate a Sharpe Ratio. More importantly, it is inherently incapable of mapping the Asset Correlation of your holdings.
"A ledger tells you the capital you possess today. A professional diagnostic engine calculates the systemic vulnerabilities that could compromise it tomorrow."
If global markets experience a 15% correction, how will your specific asset matrix react? Are your presumed "safe haven" assets structurally correlated to move in the exact same downward trajectory as your high-risk equities? In a spreadsheet environment, identifying these deep, underlying systemic risks requires extensive statistical expertise and hours of manual regression analysis.
3. The Paradigm Shift: Architected Analytics
To responsibly scale wealth, investors must upgrade their analytical tooling. This is precisely why professional fund managers do not rely on standard spreadsheets to manage systemic risk they deploy dedicated diagnostic engines.
Transitioning to a specialized financial SaaS like TwentyOne represents a fundamental shift from passive ledger maintenance to active, structured intelligence. Unlike platforms that rely on fragile, privacy-compromising bank API integrations, TwentyOne is a non-custodial environment. You retain complete, manual sovereignty over your data inputs, but the subsequent mathematical heavy lifting is entirely automated.
By simply logging your transactions, our Q-Core 21 algorithm organizes your data and instantly audits your exposure:
- Instant Structural Audits: The system automatically processes your inputs to detect if your portfolio suffers from poor diversification (High HHI) or if your compound growth is being heavily diluted by excessive uninvested liquidity.
- Interactive Correlation Networks: Mathematical models visually map exactly how your assets interact, instantly identifying which holdings act as true systemic hedges and which are silently amplifying your risk.
- Algorithmic Safeguards: Advanced logic monitors your established target allocations, providing objective alerts when an asset drifts outside your defined margins, effectively removing emotional hesitation from your rebalancing strategy.
Time to Graduate
Your capital has outgrown the limitations of a blank grid. Continuing to manage a complex, multi-asset portfolio by manually engineering mathematical formulas is akin to navigating modern financial markets with a hand-drawn map.
Maintain your data sovereignty, eliminate architectural errors, and begin understanding your true risk exposure. It is time to implement professional-grade financial infrastructure.
Related Analysis
More in Portfolio StrategyHow to Scale Your Portfolio from €1,000 to €10,000: A Strategic Roadmap for Long-Term Wealth Creation
Scale your wealth from €1k to €10k with our non-custodial portfolio tracker. Analyze CAGR and Risk of Ruin with professional tools.
Starting Small: The Three-Pillar Strategy for Growth and Real Freedom
Start investing with low capital. Balance steady Acc funds, growth engines, and gold while keeping 30% liquid to enjoy your financial sovereignty today.
TwentyOne vs Getquin: The Best Portfolio Tracker?
Looking for a Getquin alternative? See why TwentyOne is the best privacy-focused portfolio tracker to manage your total net worth like a pro CFO.